Refrigerated Asset Thermal Inspections
Shell Integrity • Insulation Leaks • Door Seals • Unit Thermal Patterns
Radiometric drone thermography + RTK precision for refrigerated trailer fleets and cold storage facilities
Trailer Fleets
Comprehensive roof and shell inspections detect moisture intrusion, insulation failures, and seal defects your ground-based team cannot safely access
Cold Storage
Facility envelope analysis, dock seal efficiency, panel joints, and refrigeration system thermal patterns—all without production downtime
Fleet Intelligence
RTK geo-tagged data, CSV/KML exports, and historical trending turn spot inspections into predictive maintenance intelligence
Why Drone Thermal Inspection vs. Handheld Cameras
Even if your maintenance team owns thermal cameras, aerial drone systems provide capabilities that ground-based inspection cannot match:
The Roof Access Problem
Trailer roofs are the #1 location for moisture intrusion leading to insulation failure and cargo spoilage. Manual roof inspection requires ladders (OSHA fall hazard), rarely achieves complete coverage, and cannot provide consistent standoff distance for quantitative measurements.
Our Solution: RTK drone systems deliver safe, comprehensive thermal mapping of roofs at 12-18 meters—eliminating fall risks and providing systematic coverage under suitable conditions (clear weather, adequate ΔT, minimal obstructions).
Standardized Methodology
Owning a thermal camera doesn't make someone a thermographer. Internal spot-checks typically vary by technician and shift, lack rigorous protocols (night inspection timing, emissivity correction, ΔT normalization), and often misinterpret reflections as actual temperature issues.
Our Solution: IEC-adapted protocols with night/pre-dawn inspection timing (minimizes solar artifacts), emissivity correction, ΔT normalization methodology (when ≥18°F ΔT achieved; target 20°F for optimal comparisons), and documented procedures for repeatable results.
Fleet Intelligence Systems
Handheld inspections produce qualitative images ("that looks hot") with no geographic coordinates, no trending capability over time, no fleet-wide benchmarking, and no structured data exports for maintenance management systems.
Our Solution: RTK-tagged radiometric data with CSV/KML exports enable historical trending, defect progression tracking, fleet benchmarking, and integration with maintenance management systems—supporting data-driven maintenance planning.
Third-Party Objectivity
Internal inspections retain all liability for missed defects. For corporate fleet integrations (acquisitions, multi-site operations), insurance claims, and regulatory compliance, independent certified audits provide unbiased documentation that internal self-assessments cannot.
Our Solution: Third-party inspection with systematic documentation provides comprehensive audit trails that may support claims, compliance, and corporate risk management—especially useful for fleet acquisitions and corporate portfolio integration. (Note: Acceptance by insurance carriers varies; consult with your insurer.)
Complementary, Not Competitive: We're not replacing your maintenance team's daily operational checks. We provide systematic monthly or quarterly audits that complement your internal operations—we identify issues at scale, your team fixes them efficiently. Minimal coordination required (scheduling, site access, results review).
What We Inspect
Refrigerated Trailer Fleets
- ▸Roof Thermal Mapping: Systematic coverage to identify moisture intrusion and insulation degradation (subject to access and environmental conditions)
- ▸Side Walls & Panels: Shell integrity and thermal bridging identification
- ▸Door Seals: Efficiency plumes showing air leakage patterns (before/after comparisons)
- ▸Refrigeration Units: Coil and housing thermal patterns (non-diagnostic observation only)
- ▸Seam & Joint Analysis: Roof seams and panel connections
Cold Storage & Processing Facilities
- ▸Building Envelope: Roof and wall thermal integrity surveys
- ▸Loading Dock Seals: Door seals and dock leveler thermal efficiency
- ▸Panel Joints: Insulated panel connections and penetrations
- ▸Refrigeration Systems: External thermal patterns of compressor rooms and condensers
- ▸Structural Penetrations: Pipe, conduit, and duct penetrations through insulated envelope
Important Scope Clarification: This inspection covers trailer and facility shell thermal integrity only. We do not inspect, certify, or provide opinions on brake systems, tires, wheel-ends, or mechanical safety systems. All mechanical systems must be inspected by certified mechanics per applicable DOT and safety regulations.
Methodology & Quality Standards
Our inspection methodology applies the same discipline used for IEC TS 62446-3 solar PV thermography, adapted specifically for refrigerated assets:
Inspection Protocols
- Night/Pre-Dawn Timing: Exterior inspections conducted at night or pre-dawn (or full overcast) to eliminate solar loading and reflections
- Thermal Contrast Requirements: ΔT_env ≥ 10°C (18°F) between interior and exterior; target 20°F for optimal detection
- ΔT Normalization: All thermal anomalies normalized to 20°F differential for consistent fleet comparisons and trending
- Emissivity Correction: ε=0.95 tape patches; Trefl ≈ shaded ambient; proper emissivity handling for metal and composite surfaces
- Quantitative Standoff: 2-20 meter standoff for accurate radiometric measurements; beyond 20m qualitative only
Equipment & Data Quality
- Radiometric Imaging: 640×512 thermal sensor with full radiometric data capture (not just visual thermal images)
- RGB Reference: 50 MP visual camera for paired thermal/visual documentation
- RTK GPS Precision: 2cm horizontal accuracy (when RTK network coverage available) for anomaly location tagging and repeat-inspection alignment
- Handheld Verification: UTi260B (256×192) for close-up validation and ground-truth measurements
- NUC Discipline: Non-uniformity correction performed before each inspection leg for consistent data
What You Receive
Safety 1-Pager (48 Hours)
Traffic-light summary (Green/Yellow/Red) for each trailer or facility zone with paired RGB/IR images showing critical issues requiring immediate attention
Engineering Appendix (5 Days)
Comprehensive report with radiometric temperatures, ΔT normalized to 20°F, anomaly classifications (C0/C1/C2/C3), RTK coordinate links, and prioritized maintenance actions
CSV/KML Data Exports
Structured data exports with trailer_id, lat/lon coordinates, temperatures, ΔT_norm values, anomaly classifications—ready for import into maintenance management or fleet tracking systems
Historical Trending (Recurring Programs)
For monthly or quarterly programs: defect progression tracking, fleet benchmarking reports, and thermal trend analysis to support maintenance planning decisions
Raw Imagery & Flight Logs
Complete archive of thermal captures (JPG+TIFF+IRG radiometric format), 50MP RGB images (JPG+DNG), and flight logs available on request for internal analysis or long-term documentation
Deliverables & Technical Specifications
Anomaly Classification Bands (ΔT normalized to 20°F / 11°C)
C0 - Investigate
3–<10°C
C1 - Minor
10–<20°C
C2 - Moderate
20–<40°C
C3 - Severe
≥40°C
Classification mirrors our IEC-style discipline used in solar PV inspections—conservative and repeatable for fleet-wide comparisons.
Example Deliverables
Download sample files to see exactly what you'll receive:
Detection Thresholds & Capabilities
Spatial Resolution
Smallest defect we'll reliably report: ≈ ≥6 cm compact anomaly at 10–12 m standoff.
Technical basis: 640×512 radiometric sensor, thermal FOV 33°×26° (13mm). At 10m standoff, horizontal ground width ≈5.92m → ~9.3mm/pixel. Reliable thermal "blob" requires ≥5×5 pixels → ≈4.6–5.5cm. We set reporting floor at ≥6cm for conservative confidence.
Door-seal plumes (tens of cm extent) and insulation voids (≥10cm footprints) sit well above this threshold under compliant conditions.
Thermal Sensitivity
Temperature differential we'll report: Flags from 3°C (C0 "investigate"); classifies at ≥10°C (C1+).
All temperatures normalized to ΔT = 20°F for fleet comparability. This threshold clears instrument accuracy (±3°C or ±3% typical radiometric spec) and reduces false positives from wind effects.
ΔT normalization formula: ΔT_norm(20°F) = ΔT_measured × (20 / ΔT_env_F)
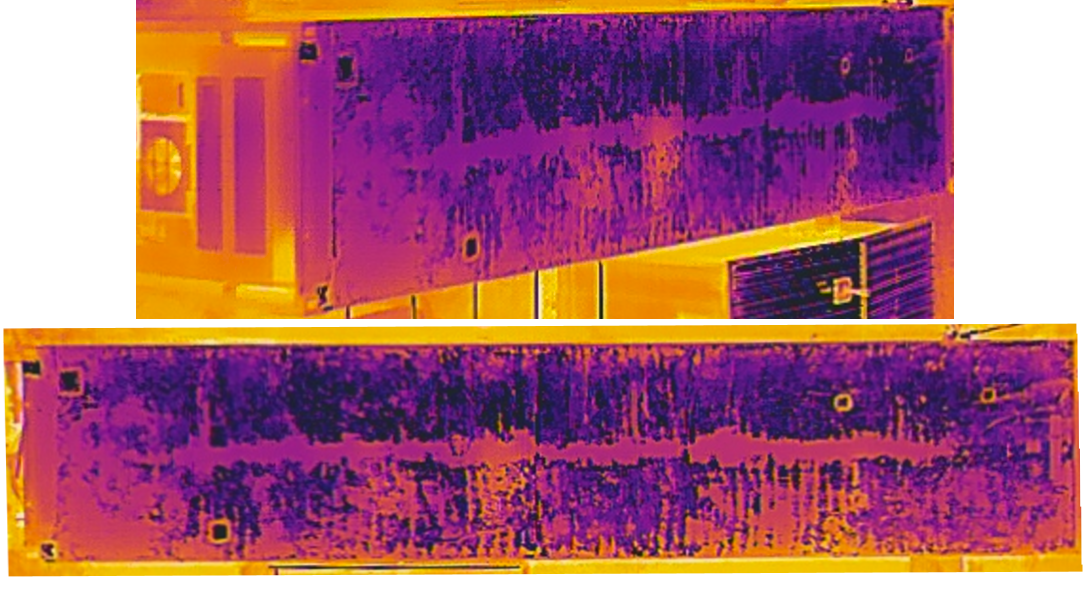
Demonstrative Case Examples
Door seal leak (upper-right): ΔT_norm = 22°C (C2) at 8.5m standoff; persistent exterior plume; confirmed with handheld inside. (Ref: RH-53001 in sample CSV/KML)
Insulation void (mid-panel curb): ΔT_norm = 12°C (C1) at 9m; panel evaluation recommended. (Ref: RH-53782)
Roof seam thermal line: Longitudinal line across front third; classed C2 by extent/morphology; sealant/fastener inspection advised. (Ref: RH-55103)
Note: These are demonstrative examples for reference formatting. Replace with pilot data when available.
Required Site Conditions
For quantitative thermal integrity assessment, inspections must meet these minimum gates:
Environmental Gates
- Time: Night / pre-dawn (or full overcast) to avoid solar artifacts
- Wind: ≤17 mph (7.6 m/s) to limit convective cooling/smear
- Contrast: ΔT_env ≥10°C (18°F) across shell; target 20°F for best results
Technical Gates
- Standoff: 2–20m for quantitative temps (beyond 20m = qualitative only)
- Radiometry: ε=0.95 on tape targets; T_refl ≈ shaded ambient; NUC performed
- Geometry: ≤60° from perpendicular on panels to reduce reflections
If Gates Are Not Met
We can still capture qualitative thermal and RGB imagery for scoping purposes, but will withhold anomaly classifications (C0–C3) and note "non-compliant conditions" in the QC sheet.
Options: (a) Reschedule to a compliant window (preferred), or (b) shift to interior handheld inspection if client can maintain inside setpoint and dwell time. We will always advise on best path forward.
These gates preserve radiometric integrity and mirror our IEC-style QC protocols used across all thermal services for quantitative work.
Data Integration (CSV / KML Exports)
Our data exports are designed for seamless integration with maintenance management systems commonly used in West Texas logistics operations.
CSV Format
- Coordinates: WGS84 lat/lon (EPSG:4326) + optional UTM 14N (EPSG:32614) for South Plains yards
- Timestamps: Local (CST/CDT) and UTC (Zulu) in every row for audit trails
- Fields: trailer_id, lat, lon, dt_local, dt_utc, ambient_C, dT_env_F, anomaly_type, dT_norm_C, class, standoff_m, RTK_fix_pct, image IDs, notes
KML Format
- Placemarks: Class-colored pins (C0 blue, C1 amber, C2 red, C3 purple) for visual prioritization
- ExtendedData: dT_env_F, standoff_m, emissivity, T_refl_C, RTK_fix_pct embedded in each placemark
- Compatibility: Opens in Google Earth, QGIS, ArcGIS, and many CMMS map plugins
Industry fit: CSVs and KMLs are the lowest-friction data interchange formats in Lubbock/Amarillo maintenance workflows based on our regional experience. GeoJSON or ESRI FileGDB also available upon request for specific CMMS integrations.
Why This Matters: Risk & ROI
Cargo Spoilage Prevention
A single reefer cargo spoilage claim can range from $50,000 to $200,000+ when product is lost. Undetected insulation failures and seal leaks may contribute to temperature variability that can lead to rejected loads and claims.
Early detection may help identify developing issues before cargo loss occurs.
Fuel Efficiency Losses
Compromised insulation can cause up to 10-15% refrigeration efficiency loss according to industry estimates. For a reefer unit running 3,500 hours/year at ~1 gallon/hour, this could represent up to $1,800+ per trailer annually in excess fuel costs (at $3.50/gal), though actual impact varies based on insulation condition, refrigeration unit age, load characteristics, and operating patterns.
Across a 15-trailer fleet: potentially $27,000+/year in fuel waste, depending on extent of insulation degradation identified and corrected.
Corporate Compliance & Integration
Fleet acquisitions and corporate integrations may benefit from objective baseline assessments. Third-party inspections can provide documentation that complements internal self-assessments for corporate due diligence purposes.
Independent inspection provides systematic documentation for fleet assessment and risk evaluation.
Predictive vs. Reactive Maintenance
Emergency trailer repairs (discovered during loading or in-transit) cost 5-10x more than scheduled preventive fixes. Systematic thermal audits identify developing issues before they cause downtime or cargo loss.
Plan repairs during scheduled maintenance windows—not roadside emergencies.
West Texas Service Area
Serving refrigerated fleets and cold storage facilities across the Texas Panhandle:
Lubbock County
Lubbock, Shallowater, Wolfforth
Hale County
Plainview, Hale Center
Randall County
Amarillo, Canyon
Swisher County
Tulia, Kress, Happy
Castro County
Dimmitt, Hart
Lamb County
Littlefield, Olton
Local advantage: No travel fees • Rapid response • Pre-dawn scheduling coordination
Important Scope & Expectations
Our IEC-adapted thermal integrity inspections deliver systematic shell envelope assessment with ΔT normalization, RTK-tagged data, and professional reporting. We provide actionable thermal intelligence for refrigerated fleet maintenance, helping you identify insulation failures, seal leaks, and thermal bridging before cargo loss occurs. Here's a transparent overview of our service parameters:
Engaging our services means you value this professional, IEC-adapted approach to refrigerated asset thermal integrity and fleet intelligence.
Ready to establish a thermal integrity baseline for your fleet or facility?
Available for refrigerated fleets (5+ trailers) and cold storage facilities (facility envelope assessment). Contact us to discuss your specific needs, confirm environmental prerequisites, and schedule an inspection window.
Rapid Safety Screen • Comprehensive Engineering Appendix • RTK-tagged data exports
Part 107 Remote Pilot • $1M UAV Liability Insurance • IEC-Adapted Methodology